Find Comparative Analysis of Wealth-Creating vs Service-Based Industries in the U.S. Economy

Fort Myers, Florida Sep 16, 2025 (Issuewire.com) Wealth-Creating vs Service-Based Industries in the U.S. Economy
This report compares industries that create long-term wealth by producing capital goods and intellectual property, versus those that primarily provide services that redistribute or consume wealth. Based on 2024 estimates, roughly 48% of U.S. GDP comes from wealth-creating industries, while 52% is service-based.
Economists often divide economic activity into wealth-creating industries (where something tangible or lasting is produced, adding to national capital) versus service-providing sectors (which circulate or consume wealth but dont necessarily expand the stock of assets). Heres a breakdown with estimates:
???? Industries That Primarily Create Wealth
These sectors convert raw materials, labor, and innovation into physical assets or intellectual property that endure beyond immediate consumption.
- Manufacturing
- Produces durable goods (cars, electronics, machinery).
- U.S. share of GDP: ~11% (2024).
- Wealth creation: High, since products can be exported, stored, and reinvested.
- Agriculture & Food Production
- Creates value by turning natural resources into consumable goods.
- U.S. GDP share: ~1% directly, but >5% when including food processing.
- Wealth creation: Medium to highfarmland itself is a lasting capital asset.
- Mining, Oil & Gas, and Energy
- Extracts natural resources, transforms into power or industrial inputs.
- GDP share: ~6%.
- Wealth creation: Strong, though finite resources mean depletion risk.
- Construction & Real Estate Development
- Creates lasting infrastructure, housing, and commercial properties.
- GDP share: ~4% (construction) and ~13% (real estate).
- Wealth creation: Highstructures increase national asset base.
- Technology & Intellectual Property (Software, R&D, Patents)
- Produces intangible but tradable assets (software, designs, patents).
- GDP share: ~9% (information sector).
- Wealth creation: High, because intellectual property can generate recurring value.
???? Industries That Primarily Provide Services
These sectors support, facilitate, or redistribute wealth but dont usually create new capital assets.
- Healthcare
- GDP share: ~1718% (largest U.S. sector).
- Service: Provides critical health services but consumes wealth (doesnt generate capital goods).
- Note: Can protect productivity, but structurally drains wealth when costs outpace outcomes.
- Finance & Insurance
- GDP share: ~8%.
- Service: Allocates and transfers wealth, but critics argue it often extracts more than it creates.
- Wealth creation: Lowexcept when financing productive investments.
- Retail & Wholesale Trade
- GDP share: ~11%.
- Service: Moves goods from producers to consumers, doesnt create new capital.
- Government Administration
- GDP share: ~1213%.
- Service: Provides regulation, defense, public goodsnecessary, but not wealth-creating in itself.
- Education
- GDP share: ~6%.
- Service: Builds human capital, which indirectly creates wealthbut output is intangible.
- Tourism, Entertainment, Arts, Hospitality
- GDP share: ~45%.
- Service: High consumer value but primarily redistributes spending.
Summary:
- Wealth-Creating Core (~4550% of GDP): Manufacturing, construction, energy, agriculture, and technology.
- Service-Based (~5055% of GDP): Healthcare, finance, retail, government, education, tourism.
A nations long-term prosperity depends on the balance: if service sectors expand while wealth-creating sectors shrink (as has happened in the U.S. since the 1970s), debt grows, and real wealth declines.GDP Share by Sector See Bar Chart
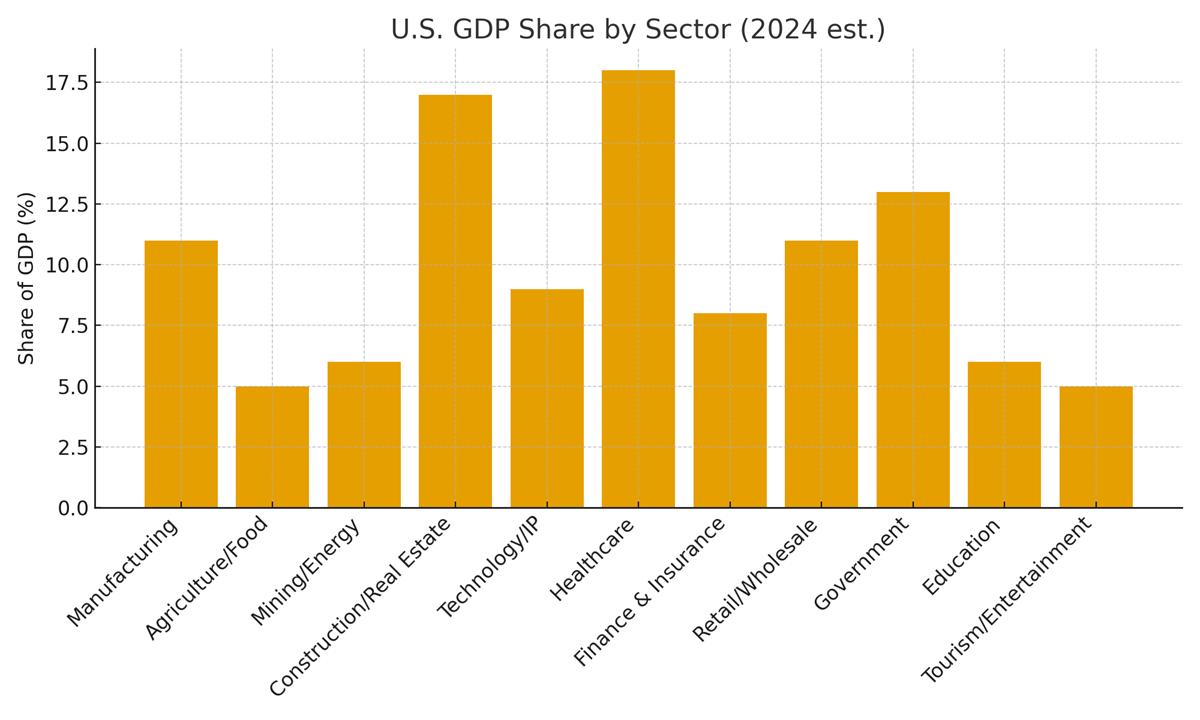
The bar chart below highlights the relative GDP share of each major industry sector in 2024. The chart illustrates the estimated 2024 distribution of U.S. GDP across major sectors. Healthcare and Construction/Real Estate are the largest contributors, together making up over one-third of the total economy. Government and Technology/IP also hold strong shares. By contrast, traditional wealth-creating industries like Manufacturing, Agriculture, and Mining make up a smaller percentage. This highlights the U.S. shift toward a service-driven economy.
Change of GDP From 1965 to 2024 See Chart
U.S. GDP Distribution: Wealth-Creating vs. Service-Based Industries
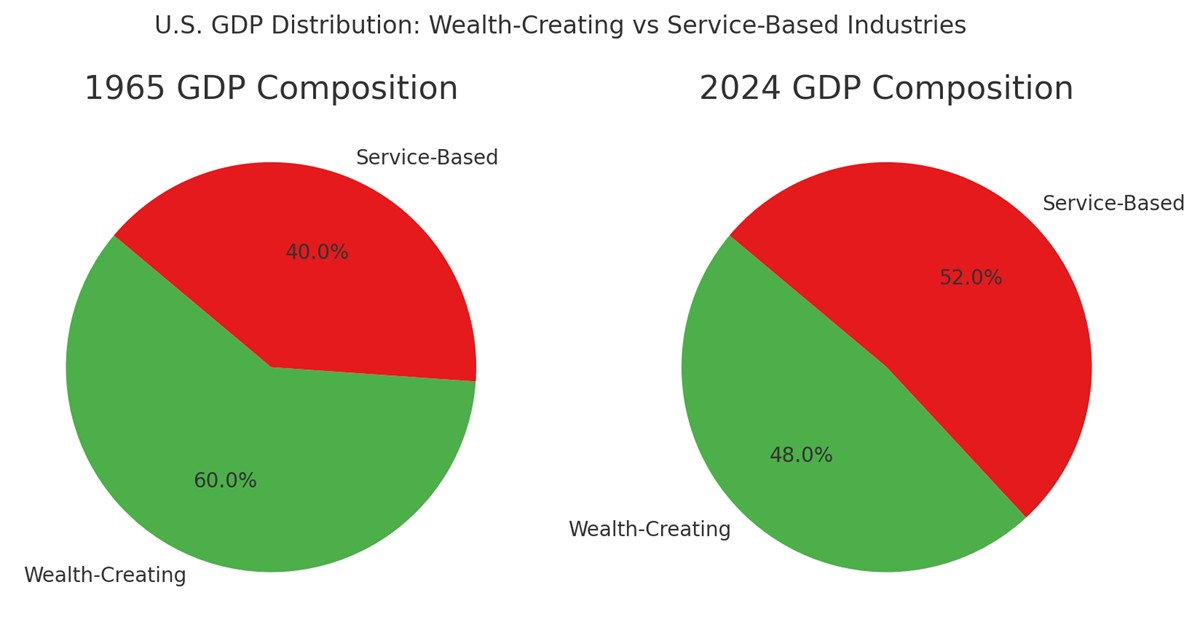
The chart compares the composition of the U.S. economy in 1965 and the 2024 estimate, highlighting the shift from wealth-creating industries (manufacturing, agriculture, energy, construction, technology) to service-based industries (healthcare, finance, government, education, tourism).
- 1965: Wealth-creating industries made up about 60% of GDP, while service-based industries accounted for 40%. This reflects an economy centered on production, tangible goods, and physical capital expansion.
- 2024 (est.): Wealth-creating industries are projected to decline to 48% of GDP, while service-based industries will rise to 52%. This demonstrates a structural shift where servicesparticularly healthcare, finance, and governmentnow represent the majority of U.S. output.
Interpretation:
This transition signifies the U.S. economys increasing reliance on service-oriented sectors. While services provide employment and social value, they are less directly tied to wealth creation in terms of producing durable, exportable, and capital-building goods. The trend raises concerns about long-term economic sustainability, trade balances, and national competitiveness.
Key Observations Shift from Manufacturing to Healthcare Industry See Chart
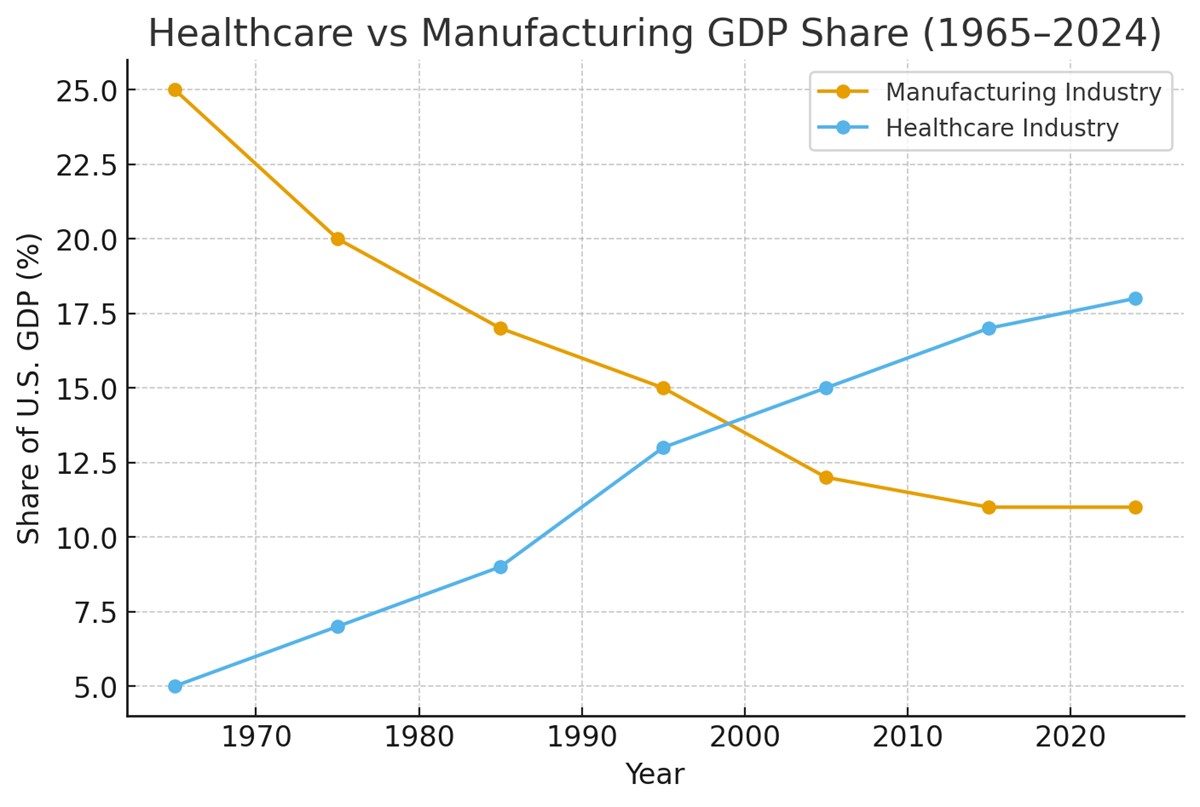
This chart tracks the share of U.S. GDP held by Manufacturing and Healthcare from 1980 to 2019. It highlights one of the most significant structural shifts in the U.S. economy over the past four decades: the steady decline of manufacturing and the simultaneous rise of healthcare.
Basically, only two industriesManufacturing and Healthcarehave dramatically shifted in GDP share. Manufacturing has fallen from a dominant role in 1965 (about one-quarter of GDP) to just 11% in 2024, while Healthcare expanded from a modest 5% in 1965 to nearly one-fifth of the economy today. This reversal underscores Americas transition from a wealth-creating, production-based economy toward a service-heavy, healthcare-dominated system.
Overall, between 1965 and 2024, the healthcare industry grew by approximately 14 percentage points, while the manufacturing industry lost about 13 percentage points of its GDP share.
U.S. National Debt and Economic Shifts See Chart
Key Observations
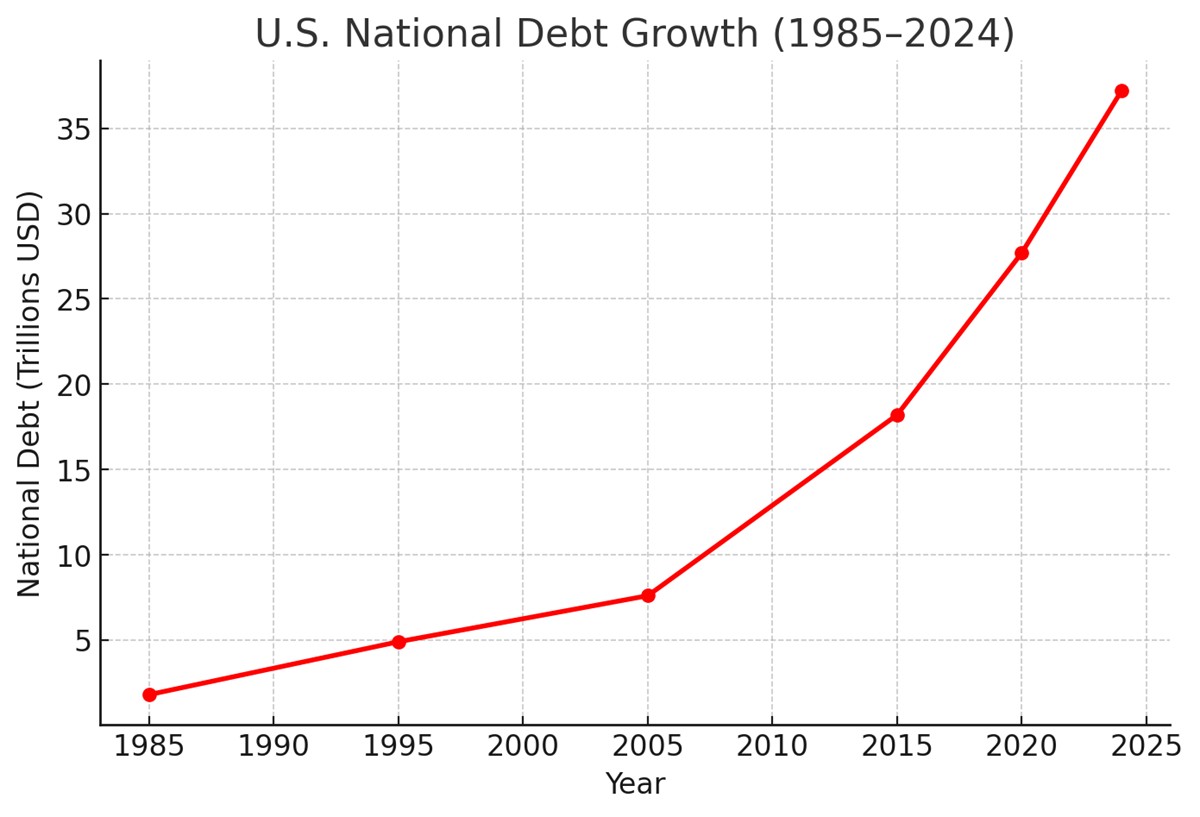
This chart illustrates the growth of U.S. national debt from 1985 to 2024. The debt has surged from under $2 trillion in the mid-1980s to over $37 trillion by 2024. The rise is not linearit accelerates after 2005, with especially sharp increases after 2015.
Conclusion
The evidence suggests that as healthcares share of the economy increased, the national debt also rose sharply. Healthcare, while essential, is largely service-based and dos not generate the same durable wealth as manufacturing. To stabilize the economy and control debt growth, the U.S. needs to revitalize manufacturing and other wealth-creating industries.
Conclusion and Policy Recommendations
Unless decisive action is taken to enforce the nations tax laws and antitrust laws within the healthcare industry, the United States faces a future of escalating economic and social instability. The unchecked growth of monopolistic hospital systems and insurance conglomerates, coupled with systematic abuse of contractual adjustments and hidden financial arrangements, continues to erode transparency, suppress competition, and deny the Treasury billions in legally owed revenues.
If these practices remain unchallenged, healthcare will consume an ever-larger share of GDP, families will face unsustainable medical debt, and the widening gap between healthcare costs and household incomes will accelerate the erosion of Americas middle class. Over time, this imbalance risks undermining national competitiveness, increasing reliance on government subsidies, and contributing directly to rising federal deficits and long-term debt.
Policy Recommendations
- Strengthening IRS Enforcement
- Mandate full recognition of billed patient revenue under accrual accounting rules, limiting misuse of contractual adjustments.
- Require hospitals and insurers to properly report forgiven or discounted amounts as taxable income under existing provisions (e.g., IRC §§ 61, 451).
- Expand IRS Whistleblower Program authority to ensure credible claims cannot be dismissed without transparent review and judicial oversight.
- Revitalize Antitrust Oversight
- Direct the Department of Justice (DOJ) and Federal Trade Commission (FTC) to investigate anticompetitive agreements between providers and insurers that steer patients and suppress price competition.
- Enforce divestitures and block mergers that concentrate excessive market power in regional healthcare systems.
- Penalize fee-splitting and kickback schemes under both federal antitrust and healthcare fraud statutes.
- Increase Transparency and Public Accountability
- Require public reporting of actual billed charges, contractual write-offs, and negotiated discounts to prevent deceptive financial reporting.
- Expand Congressional oversight hearings on healthcare finance, with specific focus on tax compliance and consumer harm.
- Support state-level initiatives that mandate disclosure of providerinsurer contracts while preserving patient protections.
- Protect Patients and Families
- Strengthen state and federal laws against balance billing, unfair debt collection, and predatory steering practices.
- Provide tax relief or credits for families burdened with out-of-pocket medical costs resulting from illegal or abusive billing practices.
Final Outlook
Without these interventions, the U.S. risks a future in which the healthcare sector becomes a permanent drain on national wealth, enriching a small group of corporate stakeholders while impoverishing families, destabilizing public finances, and eroding the nations democratic foundation. Enforcing the tax code and antitrust statutes as written is not just a legal obligation it is a moral imperative necessary to restore fairness, accountability, and long-term economic stability.


Source :Roy J. Meidinger
This article was originally published by IssueWire. Read the original article here.
Information contained on this page is provided by an independent third-party content provider. XPRMedia and this Site make no warranties or representations in connection therewith. If you are affiliated with this page and would like it removed please contact [email protected]

